
Country Groups and Aggregates
IMF classification
The main country classification used by the Global Inequality Project divides the world into two major groups: the core economies (which we gloss as the Global North) and the peripheral economies (which we gloss as the Global South), following world-system theory. We use these categories to analyse trends in global income inequality and the structure of the world economy. As a proxy for the core, we rely on the IMF’s list of “advanced economies.” For the periphery (which includes both peripheral and semi-peripheral countries) we use the IMF’s list of “emerging and developing economies.” The map below shows the IMF’s categories, with the peripheral group divided into 7 world regions to permit more detailed analysis.
While the placement of some countries can always be debated, the IMF’s categories broadly reflect the structure of the global economy in the 21st century. While the “advanced economies” have disproportionate control over the institutions of global governance, most of the “emerging and developing economies” have been subjected to structural adjustment programs and now suffer from a constant outflow of economic value through unequal exchange and financial flows. The IMF’s categorization is also consistent with the work of historian Immanuel Wallerstein on the structure of the world-economy from the 16th to 19th centuries.
Since it began using this country classification system in 1980, the IMF has reclassified 18 relatively small countries from the ‘developing’ to the ‘advanced’ group. You can separate out these ‘new core’ countries using the dropdown menu below the map.
Unless otherwise noted, the Global Inequality Project uses the IMF’s contemporary country classification (either from 2023 or 2020, depending on the page). However, analysis of long-run historical trends requires an alternative approach to account for changes in the IMF categories. For the page on global income inequality since 1960, we therefore provide three additional historical classifications which are all based on the IMF’s original (1980) groups in different ways. These are summarized in the below table.
Each of these approaches provides a different historically appropriate benchmark for analysing trends over the last 60 years. Since the composition of the core changed little during the two decades before 1980, we regard the original IMF classification as a reasonable approximation of the core during that period (for robustness checks see, Hickel & Sullivan 2026, Appendix 5). Note that when using the ‘original’ and ‘hybrid’ classification approaches, the ‘new core’ countries are allocated to their respective geographical regions in the periphery.
| IMF Classification | Definition | Purpose |
|---|---|---|
| Contemporary | Uses IMF's current (2023) classification. All countries classified as advanced economies today are treated as core. | Reflects the structure of the contemporary world-economy. |
| Original | Uses IMF's original (1980) classification. ‘New core’ countries remain classified as periphery. | Provides a fixed historical benchmark for long-run comparisons. |
| Hybrid | Uses original core and contemporary periphery. ‘New core’ countries are excluded from both groups. | Compares today's peripheral regions with the historical core. |
| Variable | Applies the relevant IMF classification in each year. Countries move from periphery to core when reclassified. Original classification is used before 1980. | Captures changes in the composition of the core over time. Useful for tracking geopolitical power and population shares. |
World Bank income groups
While most pages and visualizations use the IMF-based core-periphery classification described above, on some pages we also use the World Bank’s ‘income groups’ to provide additional information.
The World Bank divides countries into four income groups (low, lower-middle, upper-middle, and high) based on their level of Gross National Income per capita, measured in US dollars at market exchange rates. While the precise categorization changes from year to year, the map below shows how countries are classified as of 2019.
We use the World Bank’s income groups for the visualisation of external debt stocks and flows. This is because the World Bank’s International Debt Statistics database only includes low- and middle-income countries. We also use the Bank’s income groups as a supplement to the IMF-based core-periphery classification on our page titled ‘Global Economic Governance.’
It should be noted that the World Bank’s high-income group is slightly larger (around 16% of the world population as of 2019) than the IMF’s ‘advanced economies’ group (around 14%). This is because a small number of peripheral countries have incomes above the World Bank’s high-income threshold, including Saudi Arabia, Chile, Uruguay, and a few countries on the eastern border of the European Union.
Aggregations for environmental inequality
The pages and visualisations on environmental inequality are based on published studies that use other aggregations for global North and global South.
For instance, the pages titled “Responsibility for Climate Breakdown” and “Climate Reparations” use a study published in Nature Sustainability, where the global North includes the USA, Canada, Australia, New Zealand, Japan, Israel, Russia, plus the advanced economies of Europe and all of the EU-28; while the South includes several advanced economies, specifically South Korea, Hong Kong and Singapore (as well as San Marino for reasons that are not described).
The page titled “Responsibility for Excess Resource Use” uses a study published in The Lancet Planetary Health, which implements the World Bank’s classification of countries by income (see above). This study also separates out the US and UK+EU as well as “Rest of Europe and High-income countries”, with the latter group including all other high-income countries as well as all other European and Central Asian countries even if they are not high-income (including Albania, Armenia, Azerbaijan, Bosnia and Herzegovina, Georgia, Kazakhstan, Kyrgyzstan, Macedonia, Russia, Tajikistan, Turkmenistan, Ukraine, and Uzbekistan). The “Rest of South” category includes all other low- and middle-income countries, with China separated out.
The convention of classifying European countries as global North even if they are not “advanced” or “high-income” follows the logic of the “Brandt line” – an imaginary line separating the North from the South, which was proposed in 1980 by an independent commission chaired by Willy Brandt. The Brandt line was developed at the height of the Cold War, when Eastern European countries were using socialist industrial policy to rapidly build up their productive capacity and challenge their peripheral position in the world-economy. The Brandt line division stands as the other main definition of global North and global South (see map below). Since the collapse of the USSR, the Brandt line framework has become less useful in explaining international economic inequalities, and scholars have tended to move away from it (for instance, see Ferabolli’s 2021 “updated post-Cold War Brandt line,” which places Russia in the South). Nevertheless, given the resource-intensive industrial economies built in Eastern Europe during the 20th century, it remains relevant for explaining global environmental inequalities in historical context. Something like the Brandt line distinction is used in the United Nations Framework Convention on Climate Change (UNFCCC). The UNFCCC divides the world into ‘Annex 1’ countries that bear disproportionate responsibility for climate change (including both the “developed economies” of the West and the “transitional economies” of Russia and Eastern Europe) and the ‘non-Annex countries’ of the Global South.
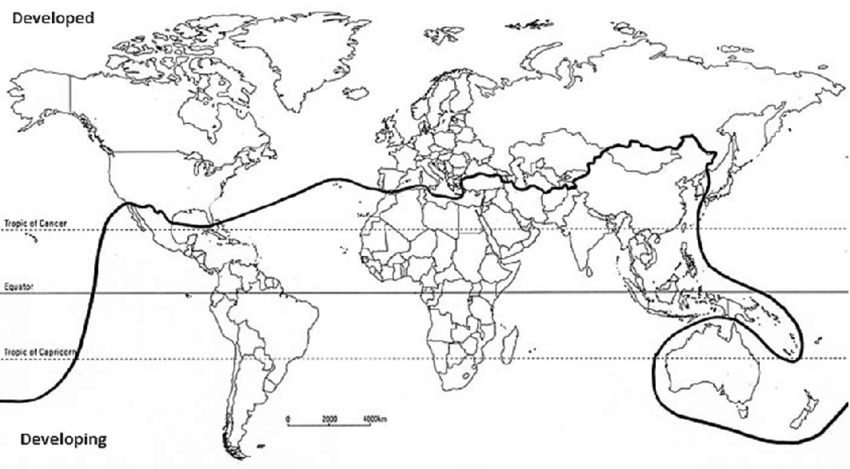
The Brandt line
Citation:
Sullivan, D., Hickel, J., & Zoomkawala, H. (2025). "Country groups and aggregates", Global Inequality Project. Accessed at: https://globalinequality.org/country-groups-and-aggregates